Main topics:
The Minimum Spanning Tree procedure was successfully used for the
decades
within the QMD transport approach and its derivatives, but was limited by the usage of the coordinate space only.
The "Phase-space Minimum Spanning Tree" (psMST)
libary was developed to overcome this limit by adding the
momentum space to the algorithm and to provide a model-independed MST version allowed to work not only with
QMD-based models but also with the BUU family and any other approach which propagate baryons. The later
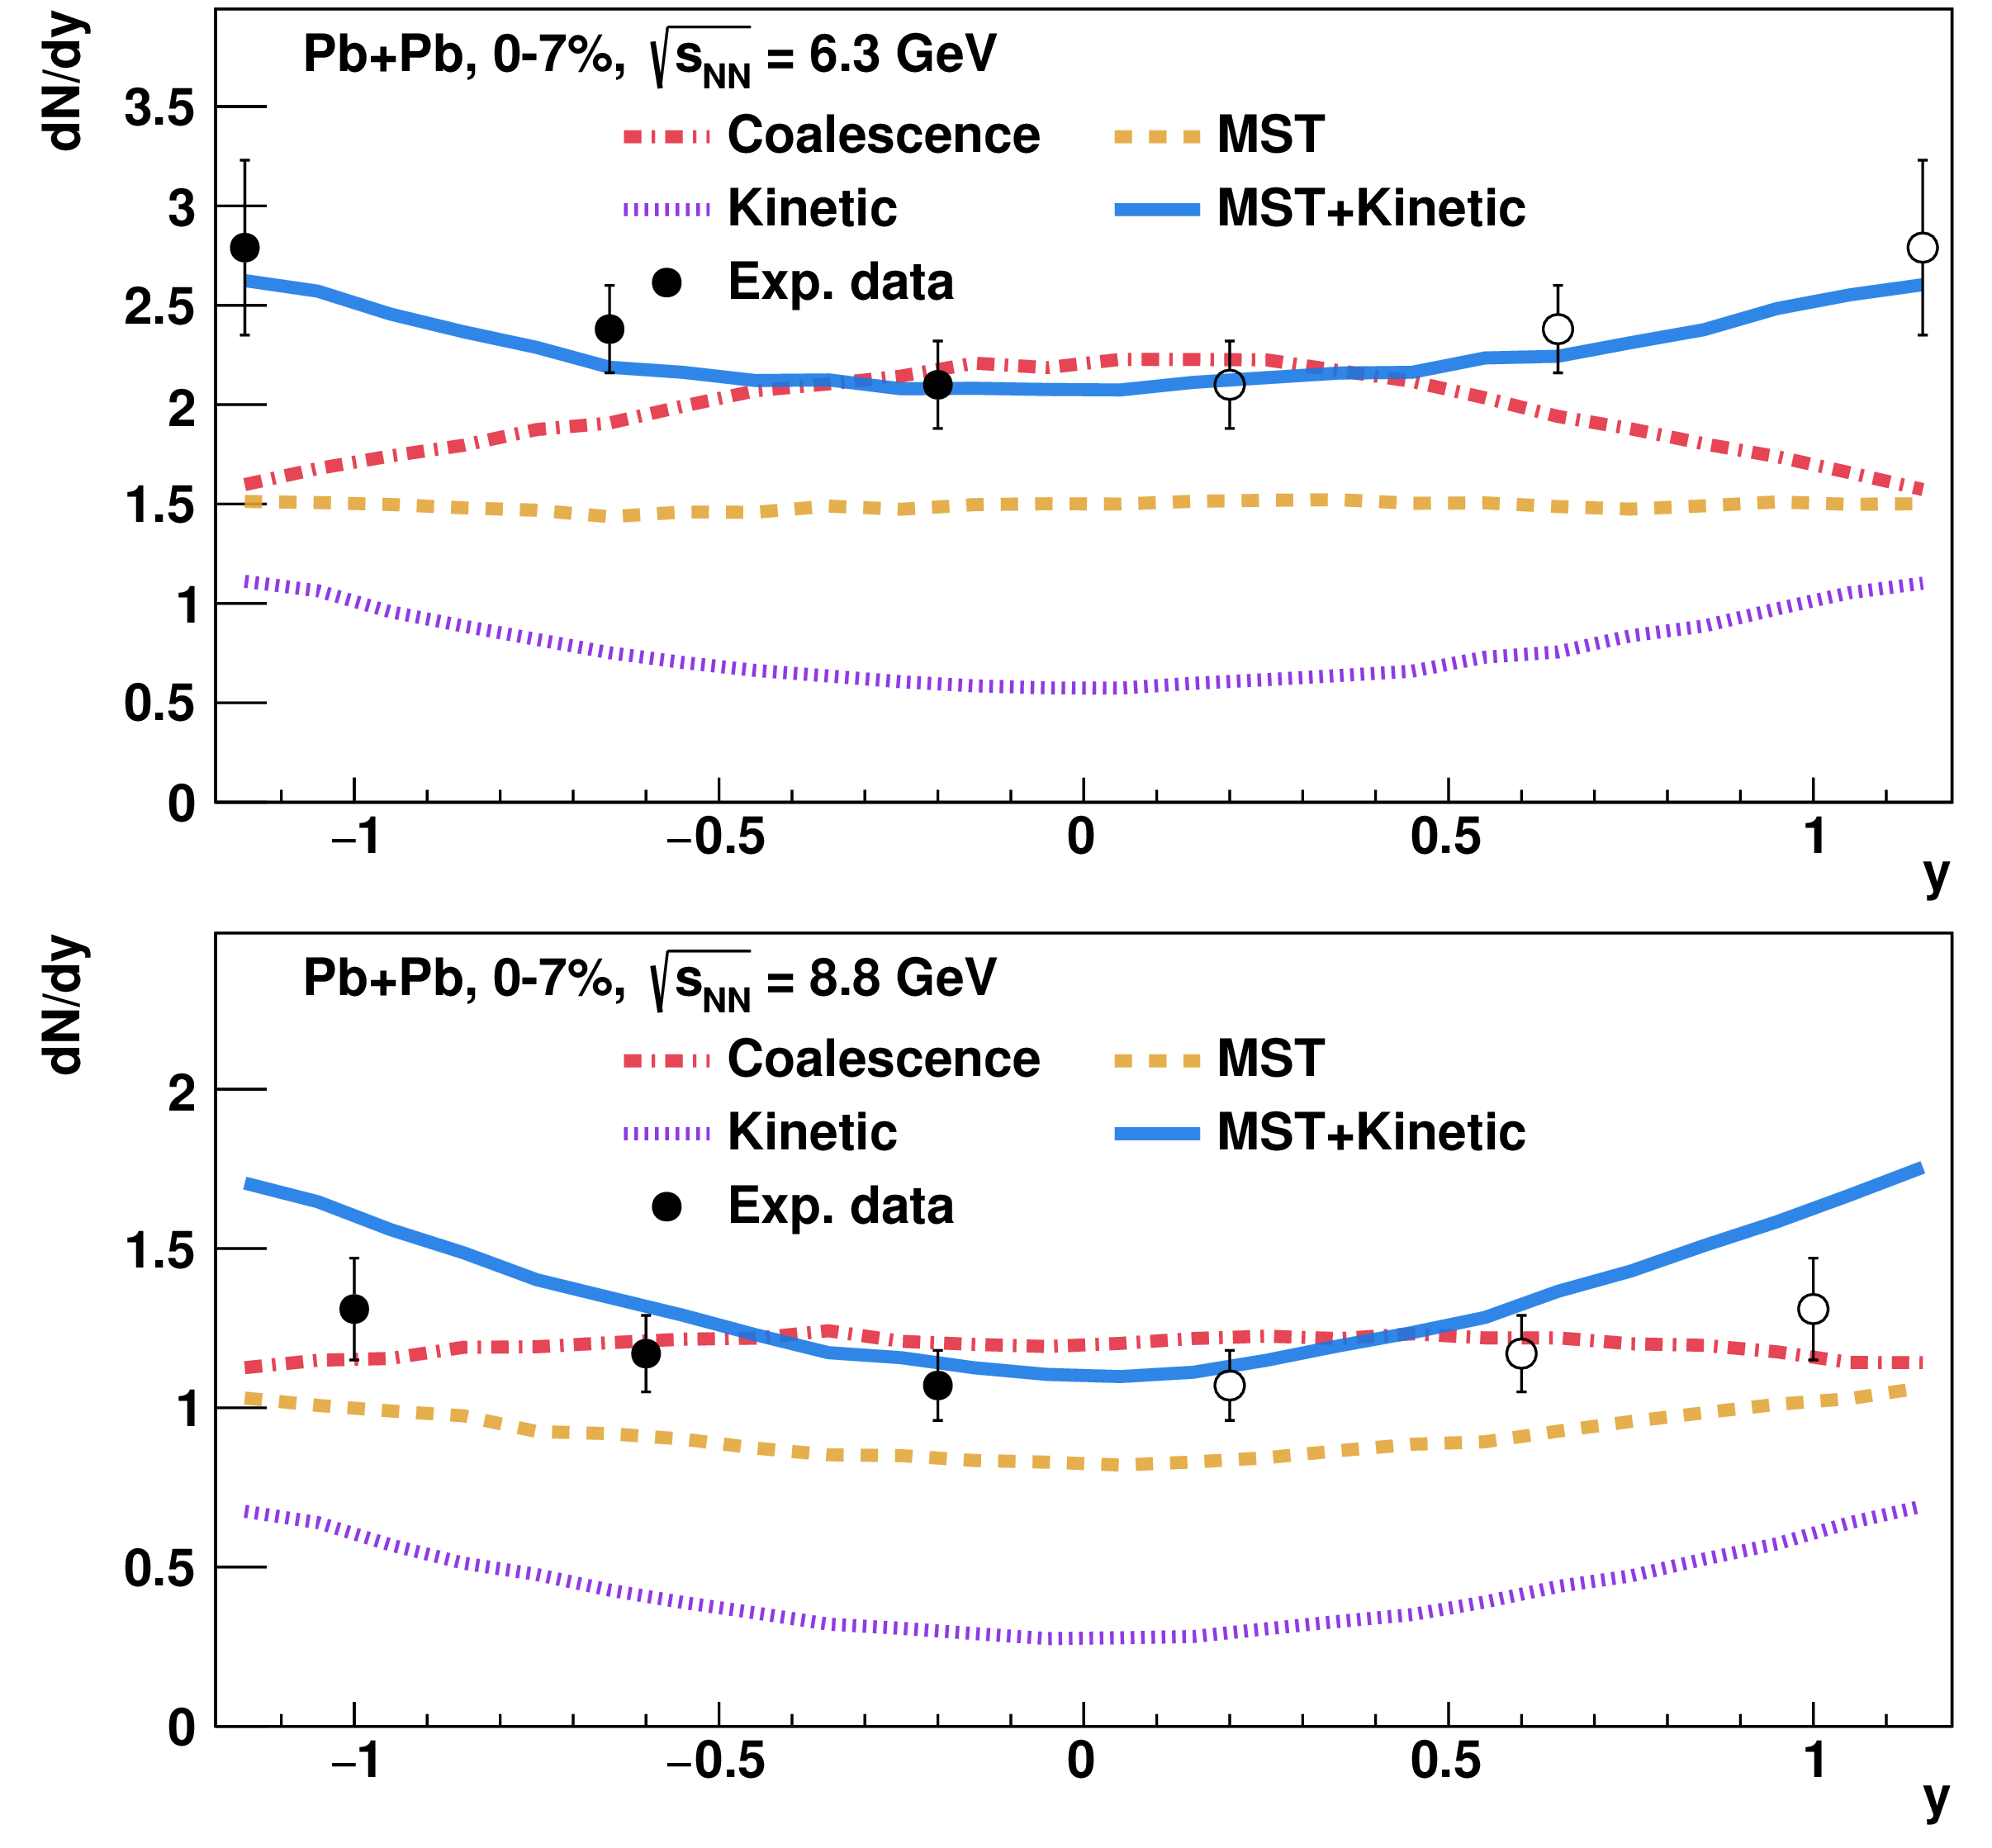
development included the coalescence algorithm for the deuterons which allows to compare two
different mechanisms of the deuterons production and to give some ideas for the further experimental measurements.
A new output file format based on the ROOT::TTree
was implemented for the PHQMD transport approach.
The new internal structure for storing the event information made it possible to speed up the analysis and
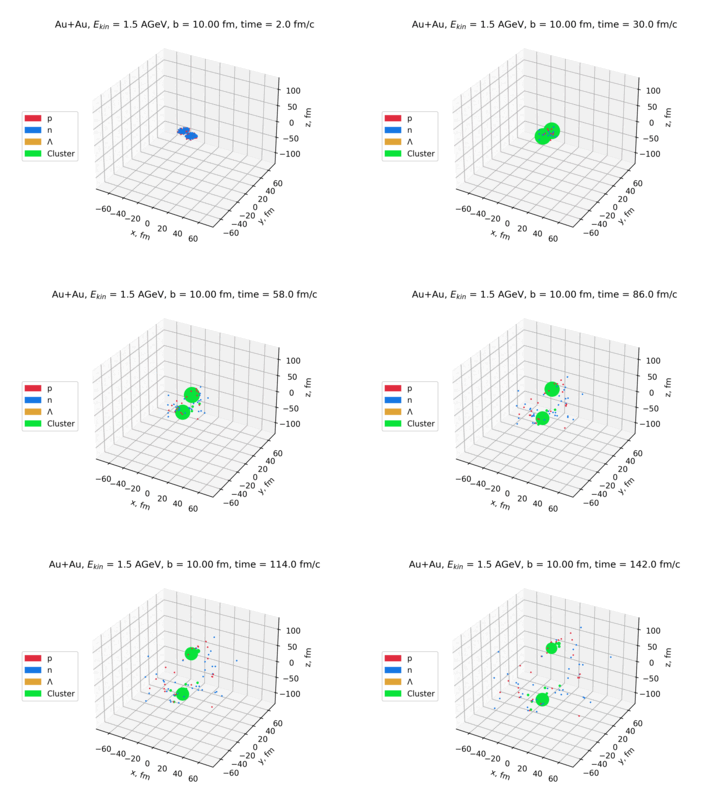
allowed to study the evolution of the heavy-ion collision within PHQMD interactively. The interactivity
was achieved by using the Plotly library.
Some event examples:
A new light nuclei analysis "wagon" was implemented for the
Multi-Purpose Detector
MpdRoot framework "train"-like analysis chain.
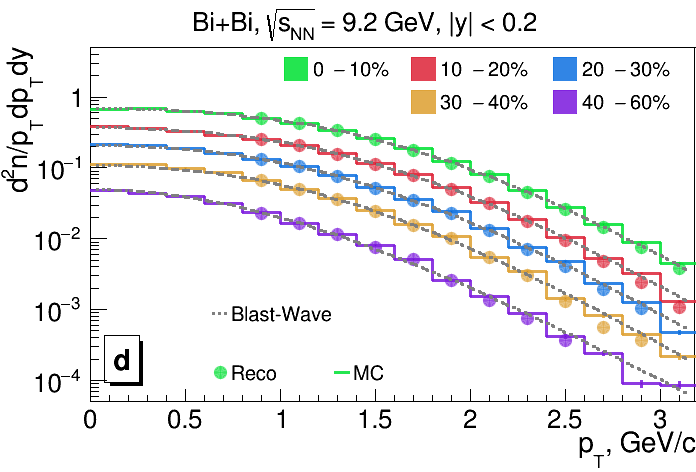
For each particle of interest and for each centrality bin it automatically provide
the phase-space distributions, the corrections for the efficiencies and contaminations, the double-differential
transverse momentum spectra and many other. The main "wagon" part is written in C++,
the post-processing analysis macro -- in Python. The source code of both parts has been
supplemented with comments of a special format for the
Doxygen documentation generator.
A QA framework for the meteorology observables was created using
PyGMT,
Plotly and
Matplotlib libraries.
It allows for the graphical representation of the different types of errors (ME, MAE, RMSE)
for the observables like wind speed (WIND), wind direction (WDIR), temperature (TMP),
total precipitation (APCP) and others at different levels e.g. P850, Z10 (surface level) etc.
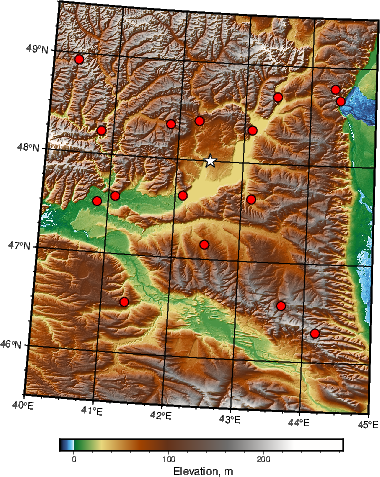
It also allows to show the meteorological stations used for analysis and other objects of interest on the map of the selected region. Some other plots:
It also allows to show the meteorological stations used for analysis and other objects of interest on the map of the selected region. Some other plots:


